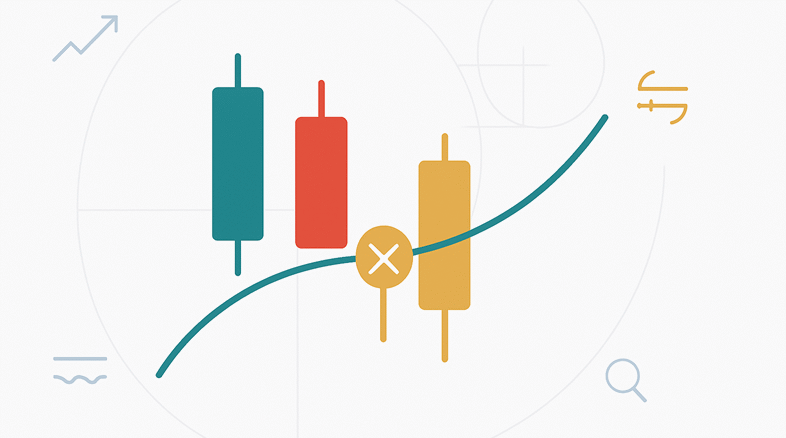
Technical analysis for stock trading isn’t just about staring at colorful charts. It’s about reading the story the market is telling through price movements and trading volumes. Think of it as learning a new language, once you get it, you can spot clues about where prices might go next.
Technical traders look at how buyers and sellers act on the chart. They do not focus on company reports or earnings.
As one veteran trader likes to say:
“Charts don’t lie. they just show you what the crowd is doing.”
The Big Ideas Behind Technical Analysis
Before jumping into the tools, it’s worth knowing the mindset behind it:
- The market already knows everything – News, earnings, rumors, it’s all baked into the price.
- Prices love to move in trends – Catching a trend early is like catching a wave before it breaks.
- History repeats itself – Patterns show up again and again because human behavior rarely changes.
Price Charts: Your Trading Map
Charts are like GPS for traders. They show where prices have been and help you figure out where they might go.
Here’s the quick rundown:
- Line charts – Clean and simple, perfect for spotting the big picture.
- Bar charts – Show more detail, like daily highs and lows.
- Candlestick charts – The favorite for most traders thanks to their rich visual patterns.
Moving Averages in Stock Trading
Moving averages are like the “mood rings” of the market, they smooth out price noise and help you see the trend.
Types You’ll See Most Often
|
Type |
What It Does |
Good For |
|
Simple (SMA) |
Average price over a set period |
Spotting long-term trends |
|
Exponential (EMA) |
Gives more weight to recent prices |
Short-term trades |
|
Weighted (WMA) |
Custom weighting |
Special strategies |
How Traders Use Them
- Spotting the trend – Price above the average? Uptrend. Price below? Downtrend.
- Support and resistance – Prices often bounce near certain averages.
- Crossover signals – When a short average crosses above a long one, it can be a sign to buy.
Example:
Imagine you see the 50-day EMA cross above the 200-day SMA. That’s the famous “golden cross” and many traders see it as a bullish sign.
Fibonacci Retracement in Stock Trading
Fibonacci retracement might sound complicated, but it’s actually easy to understand. It helps identify where the market could stop or change direction after a significant movement. It uses ratios found in nature, but in strock trading, it focuses on human psychology.
Key Levels to Know
|
Ratio |
Percentage |
Why It Matters |
|
0.236 |
23.6% |
Minor pullbacks |
|
0.382 |
38.2% |
Medium pullbacks |
|
0.500 |
50% |
Mid-point psychology |
|
0.618 |
61.8% |
Strong reversal area |
Example:
If a stock rises from $100 to $150, a 38.2% retracement is around $131. This is a level where traders may expect buyers to return.
“Fibonacci levels aren’t magic, they work because traders believe they work.”
When Moving Averages and Fibonacci Team Up
Some of the best trade setups happen when a Fibonacci level lines up perfectly with a key moving average. That’s like having two green lights at the same time, more reasons to take the trade.
Chart Patterns Worth Memorizing
Patterns are like the “faces” of the market. Once you see them enough, you’ll start spotting them everywhere:
- Head and Shoulders: Often means a trend is ending.
- Triangles: Price is coiling up, ready for a breakout.
- Double Tops and Bottoms: Signals a possible reversal.
Choosing the Right Timeframe
Your trading style will decide your chart timeframe:
- Scalpers: Seconds to minutes, fast-paced action.
- Day traders: Minutes to hours.
- Swing traders: Days to weeks.
- Position traders: Weeks to months.
Risk Management: Your Safety Net
Even the best analysis won’t save you from a bad trade if you don’t control risk.
- Risk only a small slice of your account on each trade.
- Keep it under 2% risk per position.
- Use stop-loss orders so one trade doesn’t wipe you out.
Rookie Mistakes That Cost Money
- Overloading charts with too many indicators.
- Forgetting to check the bigger market picture.
- Trading without clear entry and exit rules.
Building Your Trading Game Plan
A plan should have:
- Your chart type and timeframe.
- The indicators you trust most.
- Exact entry and exit triggers.
- A risk control strategy.
Staying Cool When the Market Isn’t
Emotions will wreck your trades faster than bad analysis. If you feel tempted to “revenge trade” after a loss, step away from the screen.
Where Technical Analysis is Headed
New tools like AI and algorithmic trading are changing the game. However, the basics still matter. Reading charts, spotting patterns, and managing risk will always be important.
Ready to Level Up?
If you’re tired of guessing when to buy or sell, start small. Choose either moving averages or Fibonacci retracement. Get comfortable with one of them. Test ideas in a demo account, take notes, and refine your edge. Once you feel confident, add more tools to your kit. That’s how you go from chart-watching to actual trading confidence.
Frequently Asked Questions
- Can I use technical analysis outside of stocks?
Yes, it works on forex, commodities, and crypto too. - Do moving averages work in flat markets?
Not really, they’re better in trending markets. - Is Fibonacci retracement always correct?
No tool is perfect, it’s about probabilities, not certainties. - Which timeframe should beginners use?
Daily charts are less noisy and easier to learn from. - How many indicators are too many?
More than three can just clutter your chart. - Should I combine technical and fundamental analysis?
Many traders do, it gives a more complete view.

