By Rania Gule, Senior Market Analyst at XS.com – MENA
The current state of the Nasdaq 100 reflects a delicate balance between hopes of monetary easing and fears of economic slowdown. Futures are pointing to slight gains, with the index up 0.12%, signaling that liquidity is still flowing into technology stocks, albeit cautiously. This behavior suggests that investors are betting more on rate cuts than on any real improvement in economic fundamentals. In my view, this divergence puts the index at a difficult crossroads, as any reversal in Fed expectations could trigger a sharp correction.
U.S. markets have reached record highs that can best be described as a “gray zone”—neither an outright bubble nor solid stability. Weak labor data leaves the door open for rate cuts, but at the same time highlights fragile growth. Relying on “economic weakness as a bullish driver” is a dangerous contradiction, since such dynamics cannot last indefinitely. With job revisions confirming the loss of one million positions as expected, I see this as a clear signal that the Fed has been late to act and may have to respond more aggressively. That could lift Nasdaq in the short term but undermine confidence in the medium run.
Looking ahead, a 25bps rate cut in September would be a measured move, but it would not change the reality of a weakening labor market. A 50bps cut, however, would signal distress and be read by markets as an admission of a deeper crisis. Such a scenario could push Nasdaq to new highs, but these would likely be short-lived, followed by sharp pullbacks once the markets fully price in the slowdown.
From a corporate perspective, the picture is mixed: Nvidia and Apple are under pressure, while Tesla and Broadcom benefit from sector-specific drivers. This divergence shows that Nasdaq’s rally is no longer broad-based as it was in 2023–24, but increasingly selective. Historically, such transitions often mark the early stages of a topping cycle. For investors, I believe the focus should be on companies with strong fundamentals and innovation in AI and tech infrastructure rather than on the index as a whole.
In commodities, gold’s surge above $3,600 is a clear reflection of declining confidence in the sustainability of U.S. growth. Historically, such jumps occur only when monetary easing bets surge amid tangible weakness. Meanwhile, oil’s third straight day of gains is a reminder that inflationary pressures can resurface quickly, leaving the Fed little room to cut aggressively. This is why investors should not treat rate cuts as a guaranteed long-term bullish catalyst.
In currencies, the dollar’s broad decline boosts near-term risk appetite but does not eliminate risks. The yen’s weakness due to political instability adds another layer of volatility. Bitcoin, meanwhile, is holding above $110,000 but failing to break key resistance, suggesting that investors prefer traditional assets like gold and equities over excessive risk. This reinforces my view that Nasdaq remains relatively strong, but only within narrow timeframes.
Ultimately, the future of the Nasdaq 100 depends on a fragile mix of monetary policy and the resilience of the technology sector. If the Fed continues gradual cuts while keeping inflation in check, the index could achieve new highs. But if labor market weakness proves deeper than expected, the rally could quickly turn into a liability for investors. My personal view is that Nasdaq will remain in an uptrend in the coming weeks, but a risky one, where any disappointment in job data or an inflation surprise could send the index much lower than traders currently anticipate.
Technical Analysis of Nasdaq 100 ( US100 ) Prices:
Technically, the US100 index on the 4-hour timeframe is still moving within a general uptrend, supported by higher highs and higher lows, reflecting relative strength in overall momentum. We can also observe the formation of a potential harmonic (Gartley) pattern near overbought levels on the Stochastic indicator, which increases the likelihood of a short-term corrective move before the main trend resumes. As long as trading remains above the key support level at 23,200, the medium-term outlook stays positive, while a clear break below this level could open the way for further downside toward 22,800.
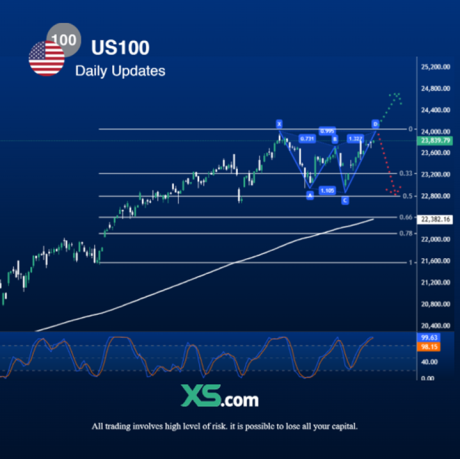
On the other hand, if the price fails to break above 23,900 and hold, we could see a pullback toward the 0.33 and 0.5 Fibonacci retracement levels as potential support zones, which align with previous lows that formed the base of the latest upward wave. The long-term moving average remaining below the price action reinforces the strength of the overall trend, but caution is warranted in case of a clear break below key support levels.
The bullish scenario would be confirmed by a breakout above 23,900 and sustained trading above it, which could open the way to test 24,200 and then 24,400 in the short term. Conversely, a break below 23,200 would alter the near-term outlook and trigger a retest of the 22,800 and possibly 22,400 levels as pivotal supports.
Support levels: 23,200 – 22,800 – 22,400
Resistance levels: 23,900 – 24,200 – 24,400