
India’s stock market is often described through two familiar numbers: the Sensex and the Nifty 50. Whether the market opens higher, slips into negative territory or closes with strong gains, these two indices dominate financial headlines and influence how investors, traders and businesses interpret market sentiment. However, while both measure the performance of India’s equity market, they represent different baskets of companies and offer distinct perspectives on the country’s economic and corporate performance.
For investors, understanding the difference between the Sensex and Nifty 50 is more than a matter of financial knowledge. These indices help assess portfolio performance, identify market trends, understand sector movements and make informed investment decisions. For traders, they are important indicators for tracking momentum, volatility, support and resistance levels, and opportunities in index-based derivatives.
Although the two indices frequently move in the same direction, their performance is not always identical. A rally in banking or information technology stocks, a correction in heavyweight companies, changes in foreign investment flows or developments in global markets can influence each index differently. Understanding what drives these movements can help market participants look beyond headline figures and make better sense of daily market activity.
What Is the Sensex?
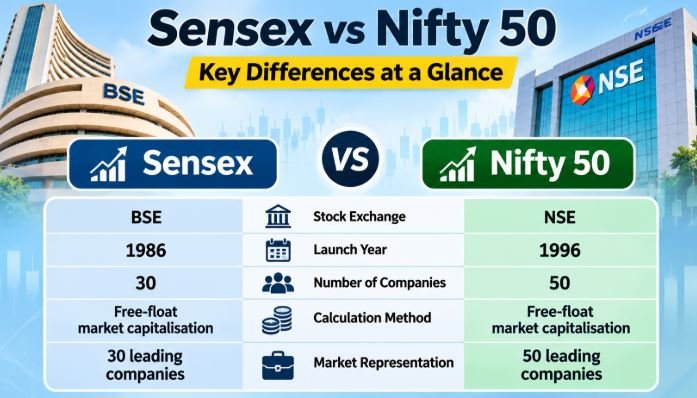
The Sensex, short for the Sensitive Index, is the benchmark stock market index of the Bombay Stock Exchange (BSE). Introduced in 1986, it tracks the performance of 30 large, financially established and actively traded companies listed on the exchange.
These companies represent important segments of the Indian economy, including banking, information technology, automobiles, energy, pharmaceuticals, consumer goods and telecommunications. Since the index includes companies with significant market capitalisation and trading activity, its movements provide a broad indication of how leading businesses are performing in the stock market.
The Sensex is calculated using the free-float market capitalisation method. This means the index considers the market value of shares available for public trading rather than the entire shareholding of a company. Shares held by promoters, governments and other strategic investors that are not normally available for trading are excluded from the calculation.
For investors, this approach offers a more realistic picture of the market value represented by publicly tradable shares. When heavyweight Sensex companies experience strong buying interest, the index can rise considerably. Similarly, selling pressure in a few influential constituents can pull the index lower even when several other stocks are trading positively.
The Sensex is therefore not simply a reflection of how 30 companies are performing individually. It also captures changes in investor expectations about corporate earnings, economic growth, interest rates and the overall business environment.
What Is the Nifty 50?
The Nifty 50 is the benchmark index of the National Stock Exchange (NSE). Launched in 1996, it tracks the performance of 50 major companies representing different sectors of the Indian economy.
Compared with the Sensex, which includes 30 constituents, the Nifty 50 covers a larger group of leading companies. Its constituents include businesses from financial services, information technology, automobiles, energy, consumer goods, healthcare, metals and other important industries.
Like the Sensex, the Nifty 50 follows the free-float market capitalisation methodology. Companies with higher free-float market values generally carry greater weight in the index, meaning their share price movements have a stronger influence on its overall performance.
The Nifty 50 has become an important reference point for domestic and international investors. It is widely used to evaluate the performance of Indian equities, compare mutual fund returns, develop investment strategies and create financial products such as index funds and exchange-traded funds.
For traders, the index is particularly significant because Nifty-linked futures and options are actively traded. Its price movements, trading volumes, market breadth and technical levels are closely monitored to understand short-term market direction.
The Nifty 50 therefore serves two important purposes: it provides investors with a benchmark for India’s leading listed companies and offers traders a widely followed instrument for participating in broader market movements.
Sensex vs Nifty 50: What Are the Major Differences?
Although both indices represent leading Indian companies and use a similar calculation methodology, they differ in their exchange, number of constituents and sectoral representation.
| Key factor | Sensex | Nifty 50 |
|---|---|---|
| Stock exchange | BSE | NSE |
| Launch year | 1986 | 1996 |
| Number of companies | 30 | 50 |
| Calculation method | Free-float market capitalisation | Free-float market capitalisation |
| Market representation | 30 leading companies | 50 leading companies |
| Major purpose | Benchmark for BSE-listed equities | Benchmark for NSE-listed equities |
| Derivatives | Sensex futures and options | Nifty 50 futures and options |
| Investor use | Market tracking and portfolio comparison | Market tracking, investment products and portfolio comparison |
One important point is that a larger number of companies does not automatically make the Nifty 50 a completely different representation of the Indian economy. Both indices include several major businesses that are common to their respective constituent lists. Consequently, they often respond to similar economic developments and global market signals.
However, differences in constituent weights and sector exposure can produce variations in daily returns. This is why investors should examine the underlying stocks and sectors rather than relying exclusively on the points gained or lost by either index.
Why Do Sensex and Nifty 50 Sometimes Move Differently?
One of the most common questions among market participants is why the Sensex rises more sharply than the Nifty 50 on certain days, or why the Nifty 50 declines even when the Sensex manages to remain positive.
The answer lies largely in the composition and weightage of the two indices.
1. Different company weightages
Every constituent does not contribute equally to an index’s movement. A company with a higher free-float market capitalisation carries greater weight than a smaller constituent. Therefore, a sharp rally in a heavily weighted Sensex stock may have a stronger influence on the Sensex than on the Nifty 50.
2. Sectoral performance
Banking, information technology, energy, automobiles and other major sectors influence both indices. However, their respective weightages are not identical. If banking stocks perform strongly while IT shares experience selling pressure, the index with relatively greater exposure to the stronger sector may outperform.
3. Corporate earnings and business developments
Quarterly financial results, revenue growth, profit margins, management commentary, dividend announcements and business expansion plans can influence the prices of individual companies. When major constituents report stronger-than-expected earnings, they may support the broader indices.
On the other hand, disappointing results, rising operating costs or weaker earnings guidance can create selling pressure.
4. Foreign and domestic institutional investment
Foreign Portfolio Investors (FPIs) and Domestic Institutional Investors (DIIs) play an important role in determining market direction. Large-scale buying or selling in heavyweight companies can influence both indices, although the impact depends on which stocks receive the investment flows.
5. Global economic developments
Movements in US markets, crude oil prices, currency fluctuations, global interest rates and geopolitical developments can influence Indian equities. Since several leading Indian companies operate in internationally connected industries, changes in global business conditions can affect their market valuations.
For investors and traders, these differences underline an important lesson: the movement of an index should always be examined alongside the stocks and sectors driving it.
How Are Sensex and Nifty 50 Calculated?
Understanding how these indices are calculated helps investors recognise why some companies influence market direction more than others.
Both indices use the free-float market capitalisation method. Under this system, the calculation considers the market value of shares available for public trading rather than the total number of shares issued by a company.
The calculation involves three important elements:
- Market capitalisation: The total market value of a company’s outstanding shares, calculated by multiplying its share price by the number of shares.
- Free-float factor: The proportion of shares available for trading in the market after excluding restricted or strategic holdings.
- Index weightage: The contribution of each constituent to the overall index based on its free-float market capitalisation.
For example, consider two companies with different market values. If the first company has a significantly higher free-float market capitalisation, its share price movement will have a greater impact on the index than that of the second company.
This explains why the Sensex or Nifty 50 can move sharply even when several individual stocks remain relatively unchanged.
It also highlights an important point for shareholders: an index rising does not necessarily mean every company in the index is performing well. The overall movement may be driven by a relatively small group of heavyweight stocks.
Why Sensex and Nifty 50 Matter to Long-Term Investors
For long-term investors, the Sensex and Nifty 50 serve as important tools for evaluating investment performance and understanding the direction of the Indian equity market.
1. Measuring portfolio performance
Investors need a benchmark to determine whether their investments are delivering satisfactory returns. The Sensex and Nifty 50 provide reference points against which equity portfolios and mutual fund investments can be evaluated.
For instance, if an investor’s portfolio delivers a 9% return over a particular period while the relevant benchmark gains 13%, it may indicate that the portfolio has underperformed the broader market.
However, comparisons should be made with suitable benchmarks, considering investment style, sector exposure and risk. Total Return Index (TRI) benchmarks are particularly useful because they include the impact of reinvested dividends.
2. Understanding economic and corporate confidence
The performance of leading companies often reflects expectations about India’s economic environment. Stronger corporate earnings, improving consumption, infrastructure investment and business expansion can support stock valuations.
When major indices maintain an upward trend, it may indicate growing confidence in corporate profitability and economic prospects. However, an index rally should not be treated as proof that every sector or business is benefiting equally.
3. Building diversified investment strategies
The Nifty 50 and Sensex are widely used as underlying benchmarks for index mutual funds and exchange-traded funds (ETFs). These products allow investors to gain exposure to a basket of leading companies without having to select every individual stock.
For investors who prefer a disciplined, long-term approach, index-based investing can offer diversification across multiple businesses and reduce the dependence on the performance of a single company.
Nevertheless, index investing still carries equity market risk. A broad market correction can affect the value of these investments.
4. Identifying market cycles
Long-term investors can monitor index movements to understand broader market phases, including bullish periods, corrections, consolidation and recoveries.
A sustained rise may reflect improving earnings expectations and stronger investment demand, while a prolonged decline may signal concerns about valuations, economic conditions or corporate profitability.
Recognising these cycles can help investors review their asset allocation and avoid making decisions based solely on short-term market excitement or panic.
Why Traders Closely Follow Sensex and Nifty 50
While investors generally focus on wealth creation over several years, traders often look for opportunities arising from shorter-term price movements. For them, both indices provide important information about market direction, momentum and volatility.
1. Tracking market trends
Traders monitor whether the indices are forming higher highs and higher lows or moving towards lower highs and lower lows. These price patterns help identify whether the market is displaying bullish or bearish characteristics.
Moving averages, trendlines and momentum indicators are also used to evaluate the strength of a market trend.
2. Identifying support and resistance levels
Support and resistance are among the most closely watched technical indicators in index trading.
Support refers to a price zone where buying interest may emerge and limit further declines. Resistance represents an area where selling pressure may increase and restrict upward movement.
For example, when Nifty 50 approaches an important resistance level, traders observe whether it breaks above that zone with strong participation or faces selling pressure.
A decisive breakout accompanied by strong volume may indicate further upside potential, while a failed breakout can lead to a reversal or consolidation.
These levels are not guaranteed turning points. They are reference areas that traders use alongside other indicators.
3. Understanding volatility and trading opportunities
Market volatility creates opportunities as well as risks. Sudden changes in index levels can influence futures and options prices, premiums and implied volatility.
Traders closely monitor volatility indicators, including India VIX, to understand changing expectations about near-term market fluctuations.
During periods of uncertainty, option premiums may increase as market participants anticipate larger price movements. However, higher premiums also reflect greater risk and do not automatically create profitable opportunities.
4. Monitoring futures and options activity
Both Sensex and Nifty 50 have active derivatives markets. Traders use index futures and options to express directional views, hedge existing portfolios and manage exposure to market movements.
Open interest, changes in futures positions, option strike concentrations and put-call data are commonly examined to understand positioning and market expectations.
However, derivatives indicators should never be interpreted in isolation. A rise in open interest, for example, does not independently confirm whether the market will move higher or lower.
5. Combining technical signals with market fundamentals
Successful trading decisions require more than identifying chart patterns. Interest rate decisions, inflation figures, corporate earnings, global market movements, crude oil prices and institutional investment flows can change the direction of the indices.
A technically strong market may face sudden pressure following an unexpected global development. Similarly, positive economic news can support a recovery even when technical indicators initially appear weak.
For traders, combining technical analysis with an understanding of market fundamentals can improve decision-making and risk management.
What Factors Influence the Daily Movement of Sensex and Nifty 50?
The daily movement of both indices is influenced by several domestic and international developments. Understanding these factors can help investors and traders distinguish between temporary market fluctuations and changes that may have longer-term implications.
Domestic institutional and foreign investment flows
Foreign Portfolio Investors (FPIs) and Domestic Institutional Investors (DIIs) are important participants in the Indian equity market. Their buying and selling activity can influence heavyweight stocks and overall market sentiment.
Heavy foreign selling may create pressure on leading companies, particularly when accompanied by global risk aversion. Domestic institutional buying can sometimes provide support during periods of uncertainty.
However, institutional flows should be viewed alongside valuations, earnings and broader economic conditions.
RBI monetary policy and interest rates
Decisions by the Reserve Bank of India (RBI) regarding the repo rate, liquidity and monetary policy can influence borrowing costs, investment activity and corporate profitability.
Lower interest rates may support businesses by reducing financing expenses and encouraging consumption and investment. However, the impact differs across sectors.
Banks, financial services companies, real estate businesses, automobiles and interest-sensitive industries may respond differently to policy changes.
Inflation and economic growth
Inflation influences household purchasing power, business input costs and the direction of monetary policy. Higher inflation can affect consumer demand and corporate margins, while moderating inflation may create a more supportive environment for economic activity.
GDP growth, industrial production, manufacturing activity and consumption trends also provide important signals about the health of the economy.
Crude oil prices and the rupee
India’s dependence on imported crude oil makes energy prices an important market variable. A sustained increase in crude oil prices can raise import costs, put pressure on inflation and affect the profitability of fuel-intensive businesses.
Currency movements also matter. A weaker rupee can increase the cost of imports while potentially benefiting certain export-oriented businesses.
Global markets and geopolitical developments
Movements in US equity markets, changes in US bond yields, Federal Reserve policy expectations and geopolitical tensions can influence international investment flows.
Since foreign investors operate across multiple markets, developments overseas can affect their appetite for emerging-market equities, including India.
For market participants, these factors are particularly important during periods when domestic economic indicators remain positive but global uncertainty creates volatility.
Does a Rising Sensex or Nifty 50 Mean the Entire Market Is Performing Well?
This is one of the most important questions investors should consider before interpreting a market rally.
A rising benchmark does not always indicate broad-based market strength. In some situations, a handful of heavyweight companies may drive the indices higher while a large number of small-cap and mid-cap stocks remain under pressure.
This is where market breadth becomes important.
Market breadth measures how many stocks are advancing compared with those declining. If both indices rise while a majority of listed stocks fall, the rally may be concentrated in a limited number of companies.
On the other hand, when gains are supported by participation across large-cap, mid-cap and small-cap segments, the market may be displaying broader strength.
Investors should therefore examine:
- The number of advancing and declining stocks.
- Performance of Nifty Bank, Nifty IT, Nifty Auto and other sectoral indices.
- Movement of mid-cap and small-cap indices.
- Buying and selling activity among institutional investors.
- Trading volumes and delivery-based participation.
- Whether index gains are supported by improving corporate earnings.
For shareholders, this distinction matters because a strong Sensex or Nifty 50 headline may not accurately reflect the performance of their individual portfolios.
Sensex or Nifty 50: Which Is Better for Investors and Traders?
There is no universal winner between the two indices. The better benchmark depends on the investor’s objective, trading strategy and investment exposure.
For investors looking to understand the performance of major companies listed on the BSE, the Sensex remains an important benchmark. Its long history also makes it useful for studying the evolution of India’s equity market over several decades.
The Nifty 50, meanwhile, offers exposure to 50 leading NSE-listed companies and is widely used in portfolio benchmarking, index funds, ETFs and derivatives trading.
For traders, the choice often depends on liquidity, transaction costs, available contracts, trading strategies and familiarity with the underlying instrument.
Rather than choosing one index and ignoring the other, market participants can monitor both to develop a more complete understanding of market direction.
When both indices rise together, it may indicate stronger confidence among investors. When their performances diverge, examining sectoral weightages and individual heavyweight stocks can help explain the difference.
Common Mistakes Investors and Traders Should Avoid
Despite the importance of benchmark indices, market participants sometimes make decisions based on incomplete interpretations of index movements.
Following points instead of percentage returns: A 500-point movement in the Sensex and a 150-point movement in the Nifty 50 cannot be directly compared. Their index levels are different, so percentage changes provide a more meaningful comparison.
Assuming index gains guarantee portfolio gains: An investor holding stocks outside the major index constituents may experience losses even when the benchmark is rising.
Ignoring valuations: A rising index does not automatically mean stocks are attractively valued. Investors should examine earnings growth, price-to-earnings ratios, debt levels and cash flow before making long-term decisions.
Overtrading during volatility: Sudden index movements can encourage emotional buying and selling. Traders who enter positions without a defined strategy or stop-loss discipline may face substantial losses.
Treating technical indicators as guarantees: Support, resistance, moving averages and derivatives data are analytical tools, not promises of future market direction.
Ignoring investment objectives: A long-term shareholder and an intraday trader operate with different time horizons. Strategies that may suit one group may be inappropriate for the other.
The Bigger Picture: Why These Two Indices Matter to India’s Financial Market
The Sensex and Nifty 50 have developed into much more than daily stock market indicators. They are important reference points for India’s financial system, influencing investment decisions, financial product development and the way businesses and investors assess market confidence.
For companies, a stronger equity market can create a favourable environment for capital raising, public offerings and investor participation. For shareholders, the indices provide a framework for evaluating portfolio performance and understanding changes in market valuations.
They also play an important role in attracting international investment. Global investors frequently use benchmark indices to assess India’s equity market, compare its performance with other economies and evaluate the potential of domestic businesses.
For retail investors, the growing availability of index funds and ETFs has made participation in the equity market more accessible. At the same time, the expansion of index derivatives has increased the importance of understanding volatility, risk exposure and disciplined trading.
However, the long-term strength of the Indian stock market cannot be judged by index levels alone. Sustainable market growth ultimately depends on corporate earnings, productivity, capital investment, consumption, financial stability and the ability of businesses to generate consistent returns.
Conclusion
The Sensex and Nifty 50 may frequently move in the same direction, but they offer different perspectives on India’s leading listed companies. While the Sensex tracks 30 major businesses on the BSE, the Nifty 50 follows 50 leading companies on the NSE. Both provide valuable insights into market sentiment, corporate performance and the broader economic environment.
For long-term shareholders, these indices help measure investment performance, understand market cycles and assess the effectiveness of portfolio strategies. For traders, they offer important signals about price momentum, volatility, derivatives positioning and potential trading opportunities.
The real advantage, however, comes from understanding what drives the numbers. A market rally supported by strong earnings, healthy participation and improving economic conditions carries a different significance from one driven by a narrow group of heavyweight stocks.
As India’s equity market continues to evolve, investors and traders who look beyond daily index movements and focus on underlying business performance, valuations and risk management will be better equipped to navigate changing market conditions.
Ultimately, the Sensex and Nifty 50 should not be viewed merely as numbers displayed on a trading screen. They are important indicators of how investors value India’s leading businesses and how expectations about the country’s economic future are reflected in the financial markets.